OSwatcher安装使用+OSwbba使用简介
OSwatcher安装+OSwbba使用简介
OSwatcher主要是监控主机的信息,一般在rac部署中这个是必须配置的,因为这样配置之后,在集群出现问题时,可以从oswbb中找到相关信息,因为当某个节点重启的时候,数据库及集群的相关日志是丢失的。当然在开sr的时候,sr有时候也是要你提交oswbb的日志去做分析的。
OSwbba主要是用来分析OSwbb产生的数据,这个就有点像nmon了,只不过nmon使用的是excel来解析数据。
OSwbb及OSwbba的参考文档:
OS Watcher Black Box User's Guide [ID 1531223.1]
OSWatcher Black Box Analyzer User Guide [ID 461053.1]
OSWatcher Black Box (Includes: [Video]) [ID 301137.1]
(一)OSwbb的安装
下载上传介质并解压(oswbb对应常用平台都支持)
[root@rhl6 /]# cd /oswbb
[root@rhl6 oswbb]# ls -l
total 1312
-rw-r--r--. 1 root root 1341440 Apr  3 12:57 oswbb601.tar
[root@rhl6 oswbb]# tar xvf oswbb601.tar
oswbb/
oswbb/src/
oswbb/src/tombody.gif
oswbb/src/Thumbs.db
oswbb/src/missing_graphic.gif
oswbb/src/OSW_profile.htm
oswbb/src/watch.gif
oswbb/src/coe_logo.gif
oswbb/src/oswbba_input.txt
oswbb/tmp/
oswbb/call_du.sh
oswbb/tarupfiles.sh
oswbb/Exampleprivate.net
oswbb/vmsub.sh
oswbb/docs/
oswbb/docs/The_Analyzer/
oswbb/docs/The_Analyzer/oswbba_README.txt
oswbb/docs/The_Analyzer/OSW_Black_Box_Analyzer_Overview.pdf
oswbb/docs/The_Analyzer/oswbba_user_guide.pdf
oswbb/docs/OSWatcher_Black_Box/
oswbb/docs/OSWatcher_Black_Box/OSWatcherUserGuide.pdf
oswbb/docs/OSWatcher_Black_Box/oswbb_README.txt
oswbb/topaix.sh
oswbb/OSWatcher.sh
oswbb/pssub.sh
oswbb/nfssub.sh
oswbb/mpsub.sh
oswbb/oswrds.sh
oswbb/profile/
oswbb/oswsub.sh
oswbb/call_sar.sh
oswbb/oswnet.sh
oswbb/OSWatcherFM.sh
oswbb/analysis/
oswbb/startOSWbb.sh
oswbb/gif/
oswbb/oswib.sh
oswbb/stopOSWbb.sh
oswbb/extras.txt
oswbb/oswbba.jar
oswbb/locks/
oswbb/iosub.sh
oswbb/xtop.sh
解压后如下
[root@rhl6 oswbb]# ls -l
total 1316
drwxr-xr-x. 9 oracle oinstall    4096 Feb 21 05:09 oswbb
-rw-r--r--. 1 root   root     1341440 Apr  3 12:57 oswbb601.tar
[root@rhl6 oswbb]# cd oswbb
[root@rhl6 oswbb]# ls -l
total 340
drwxr-xr-x. 2 oracle oinstall   4096 Feb 15 00:08 analysis
-rwxr-xr-x. 1 oracle oinstall     67 Feb 19 01:37 call_du.sh
-rwxr-xr-x. 1 oracle oinstall     68 Nov 13 01:31 call_sar.sh
drwxr-xr-x. 4 oracle oinstall   4096 Feb 14 23:54 docs
-rwxr-xr-x. 1 oracle oinstall   1864 Jan 10 02:29 Exampleprivate.net
-rwxr-xr-x. 1 oracle oinstall    632 Feb 21 05:07 extras.txt
drwxr-xr-x. 2 oracle oinstall   4096 Feb 14 23:54 gif
-rwxr-xr-x. 1 oracle oinstall    743 Oct 11 01:53 iosub.sh
drwxr-xr-x. 2 oracle oinstall   4096 Feb 21 05:06 locks
-rwxr-xr-x. 1 oracle oinstall    542 Oct 11 01:53 mpsub.sh
-rwxr-xr-x. 1 oracle oinstall    740 Oct 11 01:53 nfssub.sh
-rwxr-xr-x. 1 oracle oinstall   4424 Oct 11 01:53 OSWatcherFM.sh
-rwxr-xr-x. 1 oracle oinstall  31619 Feb 21 01:03 OSWatcher.sh
-rw-r--r--. 1 oracle oinstall 202729 Feb 21 03:29 oswbba.jar
-rwxr-xr-x. 1 oracle oinstall    414 Oct 11 01:53 oswib.sh
-rwxr-xr-x. 1 oracle oinstall    351 Oct 11 01:53 oswnet.sh
-rwxr-xr-x. 1 oracle oinstall    825 Oct 11 01:53 oswrds.sh
-rwxr-xr-x. 1 oracle oinstall    524 Oct 11 01:53 oswsub.sh
drwxr-xr-x. 2 oracle oinstall   4096 Feb 14 23:54 profile
-rwxr-xr-x. 1 oracle oinstall    547 Oct 11 01:53 pssub.sh
drwxr-xr-x. 2 oracle oinstall   4096 Feb 14 23:54 src
-rwxr-xr-x. 1 oracle oinstall   2385 Jan  9 01:08 startOSWbb.sh
-rwxr-xr-x. 1 oracle oinstall    542 Oct 11 01:53 stopOSWbb.sh
-rwxr-xr-x. 1 oracle oinstall    138 Oct 11 01:53 tarupfiles.sh
drwxr-xr-x. 2 oracle oinstall   4096 Feb 21 05:06 tmp
-rwxr-xr-x. 1 oracle oinstall    441 Jan  9 18:44 topaix.sh
-rwxr-xr-x. 1 oracle oinstall    544 Nov  8 00:55 vmsub.sh
-rwxr-xr-x. 1 oracle oinstall   1404 Oct 11 01:53 xtop.sh
数据库版本
SQL> set line 300
SQL> select * from gv$version;

   INST_ID BANNER
---------- --------------------------------------------------------------------------------
         1 Oracle Database 11g Enterprise Edition Release 11.2.0.3.0 - 64bit Production
         1 PL/SQL Release 11.2.0.3.0 - Production
         1 CORE 11.2.0.3.0      Production
         1 TNS for Linux: Version 11.2.0.3.0 - Production
         1 NLSRTL Version 11.2.0.3.0 - Production
开始使用OSwbb语法如下
ARG1 = snapshot interval in seconds. 一般在rac中建议将该参数设为10-15s
ARG2 = the number of hours of archive data to store.
ARG3 = (optional) the name of a compress utility to compress each file automatically after it is created.
ARG4 = (optional) an alternate (non default) location to store the archive directory.
以下是几个例子
Example 1: This would start the tool and collect data at default 30 second intervals and log the last 48 hours of data to archive files.
./startoswbb.sh
Example 2: This would start the tool and collect data at 60 second intervals and log the last 10 hours of data to archive files and automatically compress the files.
./startoswbb.sh 60 10 gzip
Example 3: This would start the tool and collect data at 60 second intervals and log the last 10 hours of data to archive files, compress the files and set the archive directory to a non-default location.
./startoswbb.sh 60 10 gzip /u02/tools/oswbb/archive
Example 4: This would start the tool and collect data at 60 second intervals and log the last 48 hours of data to archive files, NOT compress the files and set the archive directory to a non-default location.
./startoswbb.sh 60 48 NONE /u02/tools/oswbb/archive
开始执行OSwbb
[root@rhl6 oswbb]# ./startOSWbb.sh 10 2 gzip /oswbb/oswbb
[root@rhl6 oswbb]# Info...Zip option IS specified.
Info...OSW will use gzip to compress files.

Testing for discovery of OS Utilities...
VMSTAT found on your system.
IOSTAT found on your system.
MPSTAT found on your system.
NETSTAT found on your system.
TOP found on your system.

Testing for discovery of OS CPU COUNT
oswbb is looking for the CPU COUNT on your system
CPU COUNT will be used by oswbba to automatically look for cpu problems

CPU COUNT found on your system.
CPU COUNT = 1

Discovery completed.
这样设置之后,看以看见相关进程以及在指定的目录下有相关信息出现,如下:
[root@rhl6 ~]# ps -ef | grep osw | grep -v grep
root     14268     1  1 13:19 pts/0    00:00:05 /bin/sh ./OSWatcher.sh 10 2 gzip /oswbb/oswbb
root     14418 14268  0 13:20 pts/0    00:00:00 /bin/sh ./OSWatcherFM.sh 2 /oswbb/oswbb
[root@rhl6 archive]# pwd
/oswbb/oswbb/archive
[root@rhl6 archive]# ls -l
total 36
drwxr-xr-x. 2 root root 4096 Apr  3 13:15 oswiostat
drwxr-xr-x. 2 root root 4096 Apr  3 13:15 oswmeminfo
drwxr-xr-x. 2 root root 4096 Apr  3 13:15 oswmpstat
drwxr-xr-x. 2 root root 4096 Apr  3 13:15 oswnetstat
drwxr-xr-x. 2 root root 4096 Apr  3 13:14 oswprvtnet
drwxr-xr-x. 2 root root 4096 Apr  3 13:15 oswps
drwxr-xr-x. 2 root root 4096 Apr  3 13:15 oswslabinfo
drwxr-xr-x. 2 root root 4096 Apr  3 13:15 oswtop
drwxr-xr-x. 2 root root 4096 Apr  3 13:15 oswvmstat
停止oswbb
[root@rhl6 oswbb]# ./stopOSWbb.sh
(二)OSwbba的使用
[oracle@rhl6 archive]$ export PATH=$ORACLE_HOME/jre/1.4.2/bin:$PATH
[oracle@rhl6 archive]$ pwd
/oswbb/oswbb/archive
[oracle@rhl6 archive]$ java -jar oswbba.jar -i /oswbb/oswbb/archive
Unable to access jarfile oswbba.jar
[oracle@rhl6 archive]$ exit
logout
[root@rhl6 oswbb]# chmod 777 -R /oswbb/
[root@rhl6 oswbb]# su - oracle
[oracle@rhl6 ~]$ cd /oswbb/oswbb/archive
[oracle@rhl6 archive]$ java -version
java version "1.6.0_17"
OpenJDK Runtime Environment (IcedTea6 1.7.4) (rhel-1.21.b17.el6-x86_64)
OpenJDK 64-Bit Server VM (build 14.0-b16, mixed mode)
[oracle@rhl6 archive]$ export PATH=$ORACLE_HOME/jre/1.6.0/bin:$PATH
[oracle@rhl6 archive]$ find /oswbb/ -name oswbba.jar
/oswbb/oswbb/oswbba.jar
[oracle@rhl6 archive]$ java -jar /oswbb/oswbb/oswbba.jar -i /oswbb/oswbb/archive
Starting OSW Black Box Analyzer V6.0.1
OSWatcher Black Box Analyzer Written by Oracle Center of Expertise
Copyright (c) 2012 by Oracle Corporation
Parsing Data. Please Wait...
Scanning file headers for version and platform info...
Parsing file rhl6.0x64_iostat_13.04.03.1300.dat ...
Parsing file rhl6.0x64_vmstat_13.04.03.1300.dat ...
Parsing file rhl6.0x64_netstat_13.04.03.1300.dat ...
Parsing file rhl6.0x64_top_13.04.03.1300.dat ...
Parsing Completed.
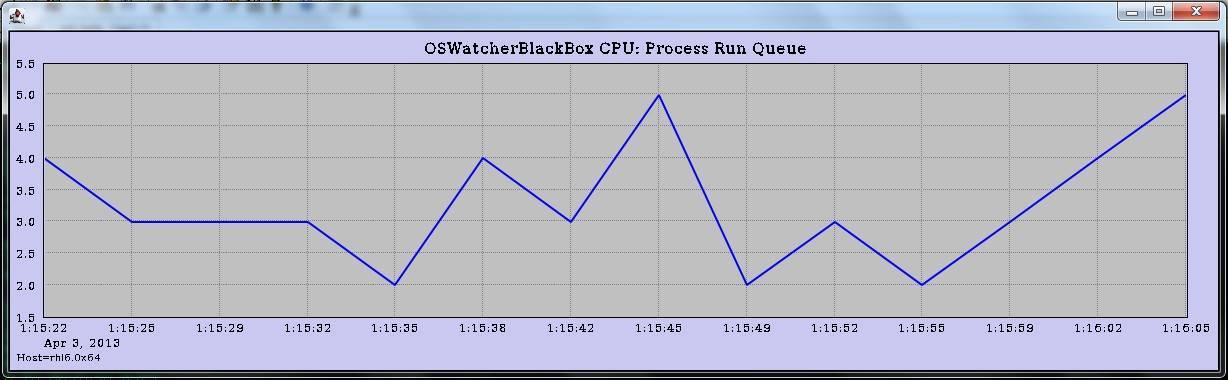
Enter 1 to Display CPU Process Queue Graphs
Enter 2 to Display CPU Utilization Graphs
Enter 3 to Display CPU Other Graphs
Enter 4 to Display Memory Graphs
Enter 5 to Display Disk IO Graphs
Enter 6 to Generate All CPU Gif Files
Enter 7 to Generate All Memory Gif Files
Enter 8 to Generate All Disk Gif Files
Enter L to Specify Alternate Location of Gif Directory
Enter T to Specify Different Time Scale
Enter D to Return to Default Time Scale
Enter R to Remove Currently Displayed Graphs
Enter P to Generate A Profile
Enter A to Analyze Data
Enter Q to Quit Program
Please Select an Option:1
Exception in thread "main" java.lang.InternalError: Can't connect to X11 window server using '192.168.137.1:0.0' as the value of the DISPLAY variable.
at sun.awt.X11GraphicsEnvironment.initDisplay(Native Method)
at sun.awt.X11GraphicsEnvironment.access$100(X11GraphicsEnvironment.java:62)
at sun.awt.X11GraphicsEnvironment$1.run(X11GraphicsEnvironment.java:166)
at java.security.AccessController.doPrivileged(Native Method)
at sun.awt.X11GraphicsEnvironment.<clinit>(X11GraphicsEnvironment.java:142)
at java.lang.Class.forName0(Native Method)
at java.lang.Class.forName(Class.java:186)
at java.awt.GraphicsEnvironment.getLocalGraphicsEnvironment(GraphicsEnvironment.java:82)
at java.awt.Window.init(Window.java:385)
at java.awt.Window.<init>(Window.java:438)
at java.awt.Frame.<init>(Frame.java:419)
at java.awt.Frame.<init>(Frame.java:384)
at g.a(Unknown Source)
at OSWGraph.OSWGraph.main(Unknown Source)
注意:该处需要设置display变量并开通远程端的图形界面
[oracle@rhl6 archive]$ java -jar /oswbb/oswbb/oswbba.jar -i /oswbb/oswbb/archive

Starting OSW Black Box Analyzer V6.0.1
OSWatcher Black Box Analyzer Written by Oracle Center of Expertise
Copyright (c)  2012 by Oracle Corporation

Parsing Data. Please Wait...

Scanning file headers for version and platform info...


Parsing file rhl6.0x64_iostat_13.04.03.1300.dat ...


Parsing file rhl6.0x64_vmstat_13.04.03.1300.dat ...

Parsing file rhl6.0x64_netstat_13.04.03.1300.dat ...


Parsing file rhl6.0x64_top_13.04.03.1300.dat ...


Parsing Completed.


Enter 1 to Display CPU Process Queue Graphs
Enter 2 to Display CPU Utilization Graphs
Enter 3 to Display CPU Other Graphs
Enter 4 to Display Memory Graphs
Enter 5 to Display Disk IO Graphs

Enter 6 to Generate All CPU Gif Files
Enter 7 to Generate All Memory Gif Files
Enter 8 to Generate All Disk Gif Files

Enter L to Specify Alternate Location of Gif Directory
Enter T to Specify Different Time Scale
Enter D to Return to Default Time Scale
Enter R to Remove Currently Displayed Graphs
Enter P to Generate A Profile
Enter A to Analyze Data
Enter Q to Quit Program

Please Select an Option:1	--此时会将cpu的图形信息通过display变量发送到指定的客户端


Enter 1 to Display CPU Process Queue Graphs
Enter 2 to Display CPU Utilization Graphs
Enter 3 to Display CPU Other Graphs
Enter 4 to Display Memory Graphs
Enter 5 to Display Disk IO Graphs

Enter 6 to Generate All CPU Gif Files
Enter 7 to Generate All Memory Gif Files
Enter 8 to Generate All Disk Gif Files

Enter L to Specify Alternate Location of Gif Directory
Enter T to Specify Different Time Scale
Enter D to Return to Default Time Scale
Enter R to Remove Currently Displayed Graphs
Enter P to Generate A Profile
Enter A to Analyze Data
Enter Q to Quit Program

Please Select an Option:q	--此时,客户端的图形界面将结束
附图如下: